Building Your Own IoT Platform : Bare Metal Basics
This article demonstrates an IoT end-to-end system where data is remotely collected using Arduinos, stored in a database, then visualized in a browser using Bing Maps and D3 charts. The implementation has been kept simple intentionally to make it easy to understand, extend and scale. All the source code is available for download and running either on a development PC or publishing to Azure Cloud (see links below). Intermediate programming, MySQL database and Arduino experience is assumed, in particular familiarity with using serial devices.
The following components are used for remote data collection:
- Arduino UNO R3 (or Leonardo, or Mega2560)
- ESP 8266 (ESP-07) serial WiFi module and breakout board
- GY-NEO6MV2 serial GPS module
For storing and visualizing data, there is one of two options. The simplest is to temporarily use our hosted test environment at http://iot.cohesivecomputing.co.uk/. Alternatively, download and install the following software components to have a similar environment running on a development PC:
- Visual Studio (any edition – community is free)
- MySql database server
The full source code can be downloaded from these links:
When installing Visual Studio, it is necessary to choose the option to also install the Azure SDK. If Visual Studio is already installed, Azure SDK can be installed separately from https://azure.microsoft.com/en-gb/downloads/.
A Bing Maps key will need to be obtained (which is free for development purposes) from https://msdn.microsoft.com/en-us/library/ff428642.aspx.
IoT End-to-End Architecture Overview

From the above diagram it can be seen that there are numerous software components in our Arduino IoT end-to-end example, all of which are necessary for an open and scalable design. An internet client device (in this case Arduino UNO) sends data to a Web API service, which after validating submits the data to a queue. A Queue Processor reads and batches data from the queue and inserts the data batches in to a database. The Web UI attempts to retrieve the current data from an in-memory cache. If the data is not in the cache, the cache is populated with data from the database and retained for a short period of time.
The benefit of using a queue instead of writing directly to the database is that queues can ingest data at much higher rates with much lower latency. In this case a single background process reading the queue and inserting data batches in to a database reduces the strain placed upon the database, resulting in a high throughput of ingested data. Ultimately, this allows lots of devices to submit data at short intervals.
Storing Telemetry Data
In principle there is no restriction on the database technology used for storing remotely collected data, which is ultimately determined by the requirements. To scale up to thousands of devices (or more) and very large volumes of data, a distributed NoSQL database (such as Cassandra) would be appropriate together with distributed equivalents of the other components. In our Arduino IoT end-to-end example, MySql has been selected to keep matters simple.

This entity relationship diagram defines broadly the database tables for storing remotely collected data. The ‘device’ table is where one or more internet enabled devices are registered and identified using a numeric Id. The ‘telemetry’ table stores the data values submitted by the registered devices, with column ‘DeviceId’ establishing a relationship with a record in the ‘device’ table. ‘ReadDate’ is the date and time (as UTC) the data values were read, and all the remaining columns are optional (i.e. data need not be supplied for these columns). Presently, only numeric data values are stored, but it shouldn’t be difficult to change or extend the storage schema as required.
To retrieve data from the database for visualization purposes a SQL query similar to below is used:
SET @device_rank = 0, @current_device = 0;
SELECT DeviceId, d.Name, ReadDate, Latitude, Longitude, Value, Value2, Value3, Value4
FROM
(
  SELECT DeviceId, ReadDate, Latitude, Longitude, Value, Value2, Value3, Value4,
  @device_rank := IF(@current_device = DeviceId, @device_rank + 1, 1) as
  device_rank, @current_device := DeviceId
  FROM telemetry
  WHERE ReadDate BETWEEN DATE_ADD(UTC_TIMESTAMP(), INTERVAL -2 MINUTE )
    AND UTC_TIMESTAMP()
  ORDER BY DeviceId, ReadDate DESC
) ranked
INNER JOIN device d ON d.Id = ranked.DeviceId
WHERE device_rank <= 12 AND d.Enabled = 1
ORDER BY d.Name, ReadDate DESC
If there is no requirement to perform analytical operations on large volumes of historical data, data that is not recent can be deleted on a daily basis. In MySql this can be achieved using events as follows:
DROP EVENT IF EXISTS DeleteOldData;
CREATE EVENT DeleteOldData
  ON SCHEDULE EVERY 1 DAY
  STARTS (TIMESTAMP(CURRENT_DATE) + INTERVAL 1 DAY + INTERVAL 1 HOUR)
  DO
    DELETE FROM Telemetry WHERE ReadDate < DATE_SUB(NOW(), INTERVAL 1 DAY);
SET GLOBAL event_scheduler = ON;
Building a Web API
To make it possible for any internet enabled device to submit data to our IoT end-to-end example, a very simple Web API service is required. Usually, web service messages are formatted as Json or Xml, but in this case it is sufficient to submit data as form fields using HTTP post. The form fields correspond directly with the database fields:
- devid – id of registered device
- date – read date
- lat – latitude
- lon – longitude
- val – numeric value 1
- val2 – numeric value 2
- val3 – numeric value 3
- val4 – numeric value 4
It is good practice to secure sensitive data transmitted over the internet, and there are numerous ways of doing this: transport security, message security and hashing.
With transport security (such as SSL) data is encrypted only during transit. Message security ensures that only the intended recipient can read the message, whereas hashing is used so the recipient can be sure that data has been sent by a trusted source.
Although it is possible for all these techniques to be implemented, even when using an Arduino UNO and ESP8266, they have not been implemented in the IoT end-to-end example to keep it simple.
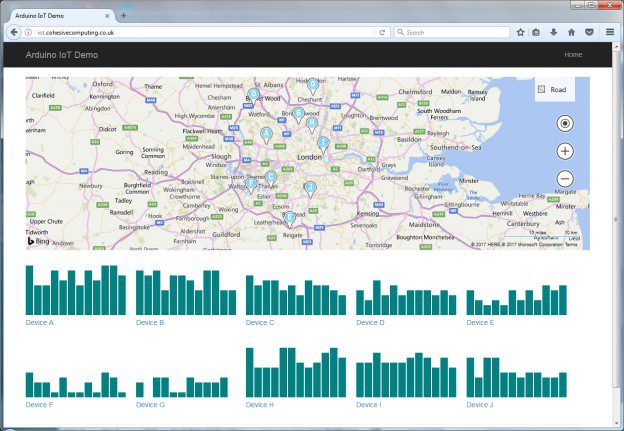
Visualizing Telemetry Data
The Web UI uses Bing Maps and overlays the map with pushpins that correspond to GPS co-ordinates submitted by a device. The JavaScript charting library D3 is used for displaying a very simple bar chart of the data stored in the ‘Value’ database column (note: missing data is not correctly indicated in our example). Below each chart is a url that links to the raw data. D3 is very versatile in its support of charting and can even be used for high level geo-mapping, instead of Bing.
In the Arduino IoT end-to-end example, the refresh rate for the pushpins and charts are independently configurable in the web.config file of the Visual Studio solution.
Arduino, Serial WiFi and Serial GPS
The Arduino source code has been tested to work with R3 Uno, Leonardo and Mega2560. As the Uno and Leonardo have only one hardware serial port (used for serial WiFi), software serial is used for reading the serial GPS module. The Leonardo and Mega2560 offer the advantage of being able to output debug messages to a serial monitor whilst running the code.

The table below identifies the Arduino pins for connecting to the WiFi and GPS modules. Arduino Tx and Rx pins connect to the WiFi Rx and Tx pins, but with the GPS module it is only necessary to connect the GPS Tx to the Arduino Rx pin. Note that the GPS module can take a while to get a fix on location after power on.
| Arduino TX,RX pins | Serial WiFi | Serial GPS |
|---|---|---|
| Uno | 1,0 | ,10 |
| Leonardo | 1,0 | ,10 |
| Mega 2560 | 18,19 | ,17 |
Remember to check the voltage requirements of both modules, as they usually require 3.3v, although some may have onboard voltage regulators that accept 5v. In either case, a level shifter or voltage divider will need to be used when connecting Arduino Tx pin (5v) to module Rx pin (3.3v).
The code fragment below illustrates the main loop for obtaining GPS co-ordinates and submitting data to the Web API service at regular intervals:
gpsReader.serialEvent();
// Process serial input.
if (gpsReader.inputComplete())
{
  if (strncmp("GPRMC", gpsReader.getInputStr(), 5) == 0)
  {
    if (millis() - lastMillis >= interval)
    {
      lastMillis = millis();
      gpsReader.stop();
      unsigned int someSensorValue = lastMillis & 15;
      char sensorValueStr[5];
      itoa(someSensorValue, sensorValueStr, 10);
      gprmc.parse(gpsReader.getInputStr());
      KeyVal formData[] = {
        {"devid", "1"}, // unique device id. For this example, fix it to a value between 1 and 10.
        {"date", gprmc.getDateTimeUtc()},
        {"lat", gprmc.getLatDD()},
        {"lon", gprmc.getLonDD()},
        {"val", sensorValueStr},
        {"val2", NULL},
        {"val3", NULL},
        {"val4", NULL},
      };
      wifiWebClient.httpPost(hostAndPort, serverApiPath, formData, keyValCount(formData));
      gpsReader.resume();
    }
  }
}
Running the Arduino IoT Client against a Test Environment
By default the Arduino source code is configured to submit data to a hosted test environment at http://iot.cohesivecomputing.co.uk/, as this is a quick and simple way to test if the Arduino is correctly submitting data. Before building and uploading the source code to your Arduino, the SSID and passkey of a suitable WiFi access point must be provided in the code.
The Arduino source code also supports debug output to a serial monitor when using Leonardo and Mega2560 boards, allowing HTTP request and response messages to be inspected. Set DEBUG_ENABLED to 1 (at the top of main source code file) to enable debugging, but be sure to set to 0 when not debugging, as leaving it enabled causes the Arduino to stall.
Running Web UI, API and MySql Locally on a PC
Running the IoT source code locally (download links available above) requires the following pre-requisites installed:
- MySql server
- Visual Studio (any edition – community edition is free)
- Azure SDK
The PC firewall must allow incoming requests on port 51560, and a configuration change must be made to allow remote connection to IIS Express. On Windows 7 (other versions may require something different), open cmd.exe as administrator and enter on the command line the following (a computer restart may be necessary):
> netsh http add urlacl url=http://*:51560/ user=everyone

> netsh advfirewall firewall add rule name="IISExpressWeb" dir=in protocol=tcp localport=51560 profile=private remoteip=localsubnet action=allow

The SQL script CreateTables.sql contains the SQL statements for creating a database schema, tables, a user and some sample IoT devices. The source code assumes MySql is installed on the local PC, although the database connection string can be configured as required in app.config and web.config of the Visual Studio solution.
A Bing Maps key must be supplied in the web.config file at line 15. The Azure storage emulator (installed as part of the Azure SDK) must be started before running the Web UI and Queue Processor, as it is the basis of queue storage. The Web API (which in this case is implemented as part of the Web UI project) submits data entries to the queue, and the Queue Processor pulls queue entries in batches (configured as MaxItemsToDequeue in app.config) and inserts the data in to the database.
To run the Visual Studio source code, press F5. The Arduino source code will need to be changed to use the PC IP address, and the SSID and passkey of a suitable WiFi access point must be provided in the code.
Those wishing to advance their Azure experience could try re-implementing the Web API code from the Web UI as an Azure function triggered by HTTP. The Queue Processor code could also be re-implemented as a queue triggered Azure function, although presently such functions only pull single items from the queue. An extension may be available that is able to pull a batch of queue entries.
Implementing Alerts
If data submitted by a device is invalid or outside acceptable thresholds, or if a device has stopped submitting data, an alerting mechanism can be implemented in a number of ways. The Queue Processor (see architecture diagram above) could be extended to monitor incoming data and send alerts (e.g. email, SMS etc) as required. Alternatively, monitoring could be implemented in a separate physical process that forms part of a data processing pipeline.
Remote Configuration of Devices
There are essentially two methods of remotely configuring IoT devices. One of the methods requires the devices to accept remote HTTP requests for configuration update, and will only work if the devices are not protected behind a firewall. The other method requires the devices to routinely poll a central server and request configuration updates. In either case a configuration application will require developing to manage the registration and configuration of IoT devices.
Power Saving Considerations
Where there is a requirement to power the Arduino modules and sensors using battery cells, a number of steps can be taken to reduce overall power consumption:
- Reduce Arduino clock speed
- Submit data to web service at longer intervals
- Place Arduino in sleep mode during inactive periods
- Put to sleep or power down other modules and sensors when not active
Note that changing the Arduino clock speed will affect the accuracy of timing functions such as millis() and delay().
Any Comments or Questions?
If you have any comments or questions about this Arduino IoT end-to-end example or perhaps require a commercial grade solution, please feel free to get in touch with me (Kashif Baig). Thank you for reading.